> ## Documentation Index
> Fetch the complete documentation index at: https://lightdash-mintlify-87860eff.mintlify.site/llms.txt
> Use this file to discover all available pages before exploring further.
# Formatting your fields
## Formatting your fields in your .yml files
Sometimes the format of things in your dbt project is different to how you want it to look in Lightdash. That's okay! We've built a bunch of features to help you to format the fields in your dbt project so that the data in your Lightdash project looks exactly like you want it to 🥸
### The [metrics](/references/metrics#metric-configuration) and [dimensions](/references/dimensions#dimension-configuration) reference docs
We're going to go through formatting your fields in more detail below, but you can see a list of these configurations and all of the other properties you can customize for your fields in the [dimensions reference doc](/references/dimensions#dimension-configuration) and [metrics reference doc](/references/metrics#metric-configuration).
### Hiding fields
Sometimes, we have a bunch of columns in our YAML files that we might not want to include in Lightdash. For example, columns with PII data, or the same date data, but at different levels of date granularity.
It's easy to hide columns from Lightdash. All you need to do is add two words to your column: `hidden: true`.
In your dbt YAML file, it'll look something like this:
```yaml theme={null}
models:
- name: users
columns:
- name: first_name
meta:
dimension:
hidden: true
```
```yaml theme={null}
models:
- name: users
columns:
- name: first_name
config:
meta:
dimension:
hidden: true
```
```yaml theme={null}
type: model
name: users
dimensions:
- name: first_name
hidden: true
```
The same thing goes for metrics:
```yaml theme={null}
models:
- name: users
columns:
- name: first_name
meta:
metrics:
count_unique_first_names:
type: count_distinct
hidden: true
```
```yaml theme={null}
models:
- name: users
columns:
- name: first_name
config:
meta:
metrics:
count_unique_first_names:
type: count_distinct
hidden: true
```
```yaml theme={null}
type: model
name: users
dimensions:
- name: first_name
metrics:
count_unique_first_names:
type: count_distinct
sql: ${TABLE}.first_name
hidden: true
```
By default, all of your dimensions and metrics have been set to `hidden: false`.
### Grouping fields in the sidebar
You can group related metrics and dimensions together using the model meta `group_details` block in combination with the `groups` property in your .yaml files. You can as well add descriptions to your groups using the property `description` that will be displayed when hovering over the group label.
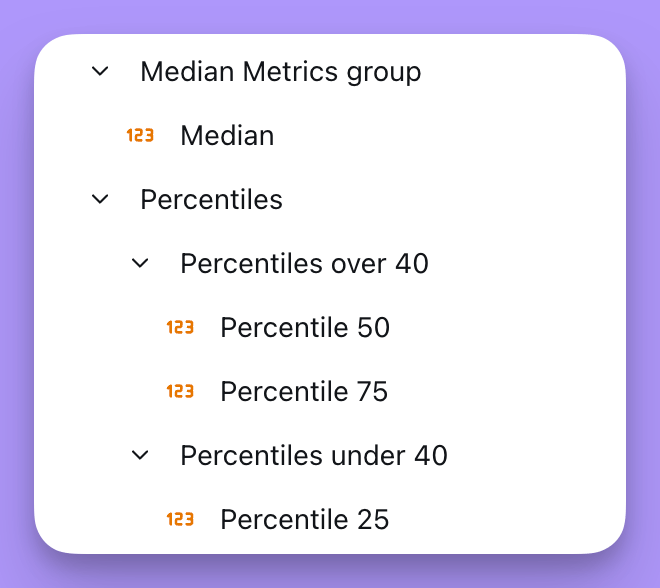
**Max grouping levels.**
There is a max of 2 levels of grouping in the sidebar.
For example you might want to group the percentile metrics into two sub categories one being for over 40 percentiles and the other for under 40 percentiles. You can do this by adding the `group` property to your metrics like so:
```yaml theme={null}
models:
- name: events
meta:
group_details:
events:
label: Events
description: Event-related fields.
percentile:
label: Percentiles
description: Grouping of percentiles
sub:
label: Percentiles under 40
description: Grouping of percentiles under 40
over:
label: Percentiles over 40
description: Grouping percentiles over 40
columns:
- name: event_id
description: ''
meta:
dimension:
type: number
groups: ['events']
metrics:
percentile_25:
type: percentile
percentile: 25
groups: ['percentile', 'sub']
percentile_50:
type: percentile
percentile: 50
groups: ['percentile', 'over']
percentile_75:
type: percentile
percentile: 75
groups: ['percentile', 'over']
```
```yaml theme={null}
models:
- name: events
config:
meta:
group_details:
events:
label: Events
description: Event-related fields.
percentile:
label: Percentiles
description: Grouping of percentiles
sub:
label: Percentiles under 40
description: Grouping of percentiles under 40
over:
label: Percentiles over 40
description: Grouping percentiles over 40
columns:
- name: event_id
description: ''
config:
meta:
dimension:
type: number
groups: ['events']
metrics:
percentile_25:
type: percentile
percentile: 25
groups: ['percentile', 'sub']
percentile_50:
type: percentile
percentile: 50
groups: ['percentile', 'over']
percentile_75:
type: percentile
percentile: 75
groups: ['percentile', 'over']
```
```yaml theme={null}
type: model
name: events
group_details:
events:
label: Events
description: Event-related fields.
percentile:
label: Percentiles
description: Grouping of percentiles
sub:
label: Percentiles under 40
description: Grouping of percentiles under 40
over:
label: Percentiles over 40
description: Grouping percentiles over 40
dimensions:
- name: event_id
description: ''
type: number
groups: ['events']
metrics:
percentile_25:
type: percentile
percentile: 25
sql: ${TABLE}.event_id
groups: ['percentile', 'sub']
percentile_50:
type: percentile
percentile: 50
sql: ${TABLE}.event_id
groups: ['percentile', 'over']
percentile_75:
type: percentile
percentile: 75
sql: ${TABLE}.event_id
groups: ['percentile', 'over']
```
 You can use groups across metrics and dimensions. In the sidebar, your metrics will get grouped together under your label in the `metrics` section, and your dimensions will get grouped together under your label in the `dimensions` section.
### Adding custom descriptions
#### Dimensions
By default, Lightdash pulls in the descriptions you've included for your dimensions. But, you can override the description you see in Lightdash using the `description` property.
```yaml theme={null}
models:
- name: users
columns:
- name: user_id
description: "Id generated by the Lightdash API on user's first login. On legacy systems, SHA64. On new systems since 2012, FARM_FINGERPRINT()"
meta:
dimension:
description: 'Unique identifier for a user'
```
```yaml theme={null}
models:
- name: users
columns:
- name: user_id
description: "Id generated by the Lightdash API on user's first login. On legacy systems, SHA64. On new systems since 2012, FARM_FINGERPRINT()"
config:
meta:
dimension:
description: 'Unique identifier for a user'
```
```yaml theme={null}
type: model
name: users
dimensions:
- name: user_id
description: 'Unique identifier for a user'
```
You can see the descriptions of your dimensions when you hover over the fields in Lightdash.
You can use groups across metrics and dimensions. In the sidebar, your metrics will get grouped together under your label in the `metrics` section, and your dimensions will get grouped together under your label in the `dimensions` section.
### Adding custom descriptions
#### Dimensions
By default, Lightdash pulls in the descriptions you've included for your dimensions. But, you can override the description you see in Lightdash using the `description` property.
```yaml theme={null}
models:
- name: users
columns:
- name: user_id
description: "Id generated by the Lightdash API on user's first login. On legacy systems, SHA64. On new systems since 2012, FARM_FINGERPRINT()"
meta:
dimension:
description: 'Unique identifier for a user'
```
```yaml theme={null}
models:
- name: users
columns:
- name: user_id
description: "Id generated by the Lightdash API on user's first login. On legacy systems, SHA64. On new systems since 2012, FARM_FINGERPRINT()"
config:
meta:
dimension:
description: 'Unique identifier for a user'
```
```yaml theme={null}
type: model
name: users
dimensions:
- name: user_id
description: 'Unique identifier for a user'
```
You can see the descriptions of your dimensions when you hover over the fields in Lightdash.
 #### Metrics
If you don't add a custom description for your metric, Lightdash will show a description for you in the app, by default. To override this default description, you can use the `description` property.
```yaml theme={null}
models:
- name: users
columns:
- name: user_id
description: "Id generated by the Lightdash API on user's first login. On legacy systems, SHA64. On new systems since 2012, FARM_FINGERPRINT()"
meta:
metrics:
count_unique_users:
type: count_distinct
description: 'Count the unique number of user IDs'
```
```yaml theme={null}
models:
- name: users
columns:
- name: user_id
description: "Id generated by the Lightdash API on user's first login. On legacy systems, SHA64. On new systems since 2012, FARM_FINGERPRINT()"
config:
meta:
metrics:
count_unique_users:
type: count_distinct
description: 'Count the unique number of user IDs'
```
```yaml theme={null}
type: model
name: users
dimensions:
- name: user_id
metrics:
count_unique_users:
type: count_distinct
sql: ${TABLE}.user_id
description: 'Count the unique number of user IDs'
```
Check out [this doc](/references/metrics#metric-configuration) to see all of the other properties you can customize for metrics.
### Renaming fields
Sometimes, the labels we use for the fields in our dbt project aren't very user friendly. We might want to change these in Lightdash, and we can!
To change the name you'll see for your field in Lightdash, you just use the `label` property.
So, if I had a field `user_id_sha64`, I could relabel it to `User ID`.
```yaml theme={null}
models:
- name: users
columns:
- name: user_id_sha64
meta:
dimension:
label: 'User ID'
```
```yaml theme={null}
models:
- name: users
columns:
- name: user_id_sha64
config:
meta:
dimension:
label: 'User ID'
```
```yaml theme={null}
type: model
name: users
dimensions:
- name: user_id_sha64
label: 'User ID'
```
Same thing goes for metrics!
Relabelling a metric will not break any saved charts that use the old metric name. Instead, your saved charts will just use the new metric name in their results tables.
```yaml theme={null}
models:
- name: users
columns:
- name: user_id_sha64
meta:
metrics:
count_unique_user_ids:
type: count_distinct
label: 'Total users'
```
```yaml theme={null}
models:
- name: users
columns:
- name: user_id_sha64
config:
meta:
metrics:
count_unique_user_ids:
type: count_distinct
label: 'Total users'
```
```yaml theme={null}
type: model
name: users
dimensions:
- name: user_id_sha64
metrics:
count_unique_user_ids:
type: count_distinct
sql: ${TABLE}.user_id_sha64
label: 'Total users'
```
Check out [this doc](/references/dimensions#dimension-configuration) to see all of the other properties you can customize for dimensions, and [this one](/references/metrics#metric-configuration) for all of the other properties you can customize for your metrics.
### Rounding
Rounding your metrics is easy to do using the `format` property in your YAML file.
Here's an example of how different rounding will affect your numbers:
| Original number | Format value | How it will appear in Lightdash |
| :-------------- | :----------- | :------------------------------ |
| 121.854 | '0.00' | 121.85 |
| 121.854 | '0.0' | 121.9 |
| 121.854 | '0' | 123 |
#### Rounding dimensions
Like this:
```yaml theme={null}
models:
- name: sales
columns:
- name: revenue
meta:
dimension:
format: '0.00'
```
```yaml theme={null}
models:
- name: sales
columns:
- name: revenue
config:
meta:
dimension:
format: '0.00'
```
```yaml theme={null}
type: model
name: sales
dimensions:
- name: revenue
format: '0.00'
```
#### Rounding metrics
Like this:
```yaml theme={null}
models:
- name: sales
columns:
- name: revenue
meta:
metrics:
total_revenue:
type: sum
format: '0.00'
```
```yaml theme={null}
models:
- name: sales
columns:
- name: revenue
config:
meta:
metrics:
total_revenue:
type: sum
format: '0.00'
```
```yaml theme={null}
type: model
name: sales
dimensions:
- name: revenue
metrics:
total_revenue:
type: sum
sql: ${TABLE}.revenue
format: '0.00'
```
Check out [this doc](https://docs.lightdash.com/references/metrics#metric-configuration) to see all of the other properties you can customize for metrics.
### Compacting big numbers
Here's an example of how different compacting will affect your numbers:
| Original number | Format value | How it will appear in Lightdash |
| --------------- | ------------ | ------------------------------- |
| 1000000000 | '0' | 1000000000 |
| 1000000000 | '0," K"' | 1000000K |
| 1000000000 | '0,," M"' | 1000M |
#### Compact dimensions
Like this:
```yaml theme={null}
models:
- name: sales
columns:
- name: revenue
meta:
dimension:
format: '0," K"'
```
```yaml theme={null}
models:
- name: sales
columns:
- name: revenue
config:
meta:
dimension:
format: '0," K"'
```
```yaml theme={null}
type: model
name: sales
dimensions:
- name: revenue
format: '0," K"'
```
As an example, this option will compact the number value from 1,500 to 1.50K.
Check out [this doc](https://docs.lightdash.com/references/dimensions#format) to see all the other compact values. to see all the other formatting options.
#### Compact metrics
Like this:
```yaml theme={null}
models:
- name: sales
columns:
- name: revenue
meta:
metrics:
total_revenue:
type: sum
format: '0.00,,," B"'
```
```yaml theme={null}
models:
- name: sales
columns:
- name: revenue
config:
meta:
metrics:
total_revenue:
type: sum
format: '0.00,,," B"'
```
```yaml theme={null}
type: model
name: sales
dimensions:
- name: revenue
metrics:
total_revenue:
type: sum
sql: ${TABLE}.revenue
format: '0.00,,," B"'
```
As an example, this option will compact the number value from 1,500,000,000 to 1.50B.
Check out [this doc](/references/metrics#format) to see all the other formatting options.
### Add units to your values
Some columns need a special format to convey what units they're in. For example, if you're a global company, and you have a `revenue` field. Is that in GBP? USD?
In Lightdash, you can use the `format` label to add units to your fields.
Here's an example of how different formats will affect your values:
| Original value | Format value | How it will appear in Lightdash |
| :------------- | :--------------- | :------------------------------ |
| 121.854 | '\[\$£]#,##0.00' | £121.85 |
| 121.854 | '\$#,##0.00' | \$121.90 |
#### Add units to dimensions
You can add a `format` to your dimensions this:
```yaml theme={null}
models:
- name: sales
columns:
- name: revenue
meta:
dimension:
format: '[$£]#,##0.00'
```
```yaml theme={null}
models:
- name: sales
columns:
- name: revenue
config:
meta:
dimension:
format: '[$£]#,##0.00'
```
```yaml theme={null}
type: model
name: sales
dimensions:
- name: revenue
format: '[$£]#,##0.00'
```
To see which format types are available for dimensions, [check the reference docs here.](/references/dimensions#format). Check out [this doc](/references/dimensions#dimension-configuration) to see all of the other properties you can customize for dimensions.
#### Add units to metrics
You can add a `format` to your metrics this:
```yaml theme={null}
models:
- name: sales
columns:
- name: revenue
meta:
metrics:
total_revenue:
type: sum
format: '[$£]#,##0.00'
```
```yaml theme={null}
models:
- name: sales
columns:
- name: revenue
config:
meta:
metrics:
total_revenue:
type: sum
format: '[$£]#,##0.00'
```
```yaml theme={null}
type: model
name: sales
dimensions:
- name: revenue
metrics:
total_revenue:
type: sum
sql: ${TABLE}.revenue
format: '[$£]#,##0.00'
```
To see which format types are available for metrics, [check the reference docs here.](/references/metrics#format)Check out [this doc](/references/metrics#metric-configuration) to see all of the other properties you can customize for metrics.
### Conditional formatting using parameters
You can make your field formatting dynamic by using [parameters](/guides/developer/using-parameters) in your format strings. This allows the format to change based on user selections without needing to reconfigure your charts.
#### Simple parameter substitution
You can reference parameter values directly in your format strings using the syntax `${ld.parameters.parameterName}`.
For example, if you have a parameter called `currency_symbol`, you can use it in your format like this:
**Step 1: Define your parameter**
In your `lightdash.config.yml` file:
```yaml theme={null}
parameters:
currency_symbol:
label: "Currency symbol"
description: "Conditional formatting for currency symbol"
default: "$"
options:
- "$"
- "€"
```
**Step 2: Use the parameter in your format string**
In your model YAML file:
```yaml theme={null}
models:
- name: sales
columns:
- name: revenue
meta:
metrics:
total_revenue:
type: sum
format: '${ld.parameters.currency_symbol}0,0.00'
```
```yaml theme={null}
models:
- name: sales
columns:
- name: revenue
config:
meta:
metrics:
total_revenue:
type: sum
format: '${ld.parameters.currency_symbol}0,0.00'
```
```yaml theme={null}
type: model
name: sales
dimensions:
- name: revenue
metrics:
total_revenue:
type: sum
sql: ${TABLE}.revenue
format: '${ld.parameters.currency_symbol}0,0.00'
```
The format `'${ld.parameters.currency_symbol}0,0.00'` will substitute the selected currency symbol value directly into the format.
When users select `$` from the parameter dropdown, numbers will display as `$1,234.56`. When they select `€`, numbers will display as `€1,234.56`.
#### Conditional formatting with ternary expressions
For more complex formatting logic, you can use ternary expressions in your format strings. The syntax is:
```
${ld.parameters.parameterName=="value"?"format_if_true":"format_if_false"}
```
Here's an example that displays different currency symbols based on a `currency` parameter:
**Step 1: Define your parameter**
In your `lightdash.config.yml` file:
```yaml theme={null}
parameters:
currency:
label: "Currency"
description: "Conditional formatting for currency"
default: "usd"
options:
- "usd"
- "eur"
- "gbp"
```
**Step 2: Use the parameter in your format string with conditional logic**
In your model YAML file:
```yaml theme={null}
models:
- name: sales
columns:
- name: revenue
meta:
metrics:
total_revenue:
type: sum
format: '${ld.parameters.currency=="usd"?"$":""}${ld.parameters.currency=="eur"?"€":""}${ld.parameters.currency=="eur"?"£":""}0,0.00'
```
```yaml theme={null}
models:
- name: sales
columns:
- name: revenue
config:
meta:
metrics:
total_revenue:
type: sum
format: '${ld.parameters.currency=="usd"?"$":""}${ld.parameters.currency=="eur"?"€":""}${ld.parameters.currency=="eur"?"£":""}0,0.00'
```
```yaml theme={null}
type: model
name: sales
dimensions:
- name: revenue
metrics:
total_revenue:
type: sum
sql: ${TABLE}.revenue
format: '${ld.parameters.currency=="usd"?"$":""}${ld.parameters.currency=="eur"?"€":""}${ld.parameters.currency=="eur"?"£":""}0,0.00'
```
The format uses multiple ternary expressions to check the parameter value:
* When `currency` is `"usd"`, displays `$1,234.56`
* When `currency` is `"eur"`, displays `€1,234.56`
* When `currency` is `"gbp"`, displays `£1,234.56`
**Another example: Controlling decimal places**
You can use conditional formatting to toggle between different precision levels.
Define your parameter in `lightdash.config.yml`:
```yaml theme={null}
parameters:
decimals:
label: "Decimals"
description: "Conditional formatting for decimals"
default: "true"
options:
- "true"
- "false"
```
Then use it in your model YAML file:
```yaml theme={null}
models:
- name: sales
columns:
- name: revenue
meta:
metrics:
total_revenue:
type: sum
format: '0,0${ld.parameters.decimals=="true"?".00":""}'
```
```yaml theme={null}
models:
- name: sales
columns:
- name: revenue
config:
meta:
metrics:
total_revenue:
type: sum
format: '0,0${ld.parameters.decimals=="true"?".00":""}'
```
```yaml theme={null}
type: model
name: sales
dimensions:
- name: revenue
metrics:
total_revenue:
type: sum
sql: ${TABLE}.revenue
format: '0,0${ld.parameters.decimals=="true"?".00":""}'
```
When `decimals` is `"true"`, numbers display as `$1,234.56`. When `decimals` is `"false"`, numbers display as `$1,235`.
## Formatting your fields in the Lightdash UI
You can also format your fields in the Lightdash UI. This is useful if you want to format your fields quickly without having to change your YAML files.
Currently you can format 2 types of fields in the Lightdash UI:
* Custom metrics ([reference](/guides/custom-fields#custom-metrics))
* Table calculations ([reference](/guides/table-calculations))
### Formatting metrics
Metrics formatting is currently only available for numeric metric types.
You can adjust the formatting of your pre-defined metrics from the results table.
#### Metrics
If you don't add a custom description for your metric, Lightdash will show a description for you in the app, by default. To override this default description, you can use the `description` property.
```yaml theme={null}
models:
- name: users
columns:
- name: user_id
description: "Id generated by the Lightdash API on user's first login. On legacy systems, SHA64. On new systems since 2012, FARM_FINGERPRINT()"
meta:
metrics:
count_unique_users:
type: count_distinct
description: 'Count the unique number of user IDs'
```
```yaml theme={null}
models:
- name: users
columns:
- name: user_id
description: "Id generated by the Lightdash API on user's first login. On legacy systems, SHA64. On new systems since 2012, FARM_FINGERPRINT()"
config:
meta:
metrics:
count_unique_users:
type: count_distinct
description: 'Count the unique number of user IDs'
```
```yaml theme={null}
type: model
name: users
dimensions:
- name: user_id
metrics:
count_unique_users:
type: count_distinct
sql: ${TABLE}.user_id
description: 'Count the unique number of user IDs'
```
Check out [this doc](/references/metrics#metric-configuration) to see all of the other properties you can customize for metrics.
### Renaming fields
Sometimes, the labels we use for the fields in our dbt project aren't very user friendly. We might want to change these in Lightdash, and we can!
To change the name you'll see for your field in Lightdash, you just use the `label` property.
So, if I had a field `user_id_sha64`, I could relabel it to `User ID`.
```yaml theme={null}
models:
- name: users
columns:
- name: user_id_sha64
meta:
dimension:
label: 'User ID'
```
```yaml theme={null}
models:
- name: users
columns:
- name: user_id_sha64
config:
meta:
dimension:
label: 'User ID'
```
```yaml theme={null}
type: model
name: users
dimensions:
- name: user_id_sha64
label: 'User ID'
```
Same thing goes for metrics!
Relabelling a metric will not break any saved charts that use the old metric name. Instead, your saved charts will just use the new metric name in their results tables.
```yaml theme={null}
models:
- name: users
columns:
- name: user_id_sha64
meta:
metrics:
count_unique_user_ids:
type: count_distinct
label: 'Total users'
```
```yaml theme={null}
models:
- name: users
columns:
- name: user_id_sha64
config:
meta:
metrics:
count_unique_user_ids:
type: count_distinct
label: 'Total users'
```
```yaml theme={null}
type: model
name: users
dimensions:
- name: user_id_sha64
metrics:
count_unique_user_ids:
type: count_distinct
sql: ${TABLE}.user_id_sha64
label: 'Total users'
```
Check out [this doc](/references/dimensions#dimension-configuration) to see all of the other properties you can customize for dimensions, and [this one](/references/metrics#metric-configuration) for all of the other properties you can customize for your metrics.
### Rounding
Rounding your metrics is easy to do using the `format` property in your YAML file.
Here's an example of how different rounding will affect your numbers:
| Original number | Format value | How it will appear in Lightdash |
| :-------------- | :----------- | :------------------------------ |
| 121.854 | '0.00' | 121.85 |
| 121.854 | '0.0' | 121.9 |
| 121.854 | '0' | 123 |
#### Rounding dimensions
Like this:
```yaml theme={null}
models:
- name: sales
columns:
- name: revenue
meta:
dimension:
format: '0.00'
```
```yaml theme={null}
models:
- name: sales
columns:
- name: revenue
config:
meta:
dimension:
format: '0.00'
```
```yaml theme={null}
type: model
name: sales
dimensions:
- name: revenue
format: '0.00'
```
#### Rounding metrics
Like this:
```yaml theme={null}
models:
- name: sales
columns:
- name: revenue
meta:
metrics:
total_revenue:
type: sum
format: '0.00'
```
```yaml theme={null}
models:
- name: sales
columns:
- name: revenue
config:
meta:
metrics:
total_revenue:
type: sum
format: '0.00'
```
```yaml theme={null}
type: model
name: sales
dimensions:
- name: revenue
metrics:
total_revenue:
type: sum
sql: ${TABLE}.revenue
format: '0.00'
```
Check out [this doc](https://docs.lightdash.com/references/metrics#metric-configuration) to see all of the other properties you can customize for metrics.
### Compacting big numbers
Here's an example of how different compacting will affect your numbers:
| Original number | Format value | How it will appear in Lightdash |
| --------------- | ------------ | ------------------------------- |
| 1000000000 | '0' | 1000000000 |
| 1000000000 | '0," K"' | 1000000K |
| 1000000000 | '0,," M"' | 1000M |
#### Compact dimensions
Like this:
```yaml theme={null}
models:
- name: sales
columns:
- name: revenue
meta:
dimension:
format: '0," K"'
```
```yaml theme={null}
models:
- name: sales
columns:
- name: revenue
config:
meta:
dimension:
format: '0," K"'
```
```yaml theme={null}
type: model
name: sales
dimensions:
- name: revenue
format: '0," K"'
```
As an example, this option will compact the number value from 1,500 to 1.50K.
Check out [this doc](https://docs.lightdash.com/references/dimensions#format) to see all the other compact values. to see all the other formatting options.
#### Compact metrics
Like this:
```yaml theme={null}
models:
- name: sales
columns:
- name: revenue
meta:
metrics:
total_revenue:
type: sum
format: '0.00,,," B"'
```
```yaml theme={null}
models:
- name: sales
columns:
- name: revenue
config:
meta:
metrics:
total_revenue:
type: sum
format: '0.00,,," B"'
```
```yaml theme={null}
type: model
name: sales
dimensions:
- name: revenue
metrics:
total_revenue:
type: sum
sql: ${TABLE}.revenue
format: '0.00,,," B"'
```
As an example, this option will compact the number value from 1,500,000,000 to 1.50B.
Check out [this doc](/references/metrics#format) to see all the other formatting options.
### Add units to your values
Some columns need a special format to convey what units they're in. For example, if you're a global company, and you have a `revenue` field. Is that in GBP? USD?
In Lightdash, you can use the `format` label to add units to your fields.
Here's an example of how different formats will affect your values:
| Original value | Format value | How it will appear in Lightdash |
| :------------- | :--------------- | :------------------------------ |
| 121.854 | '\[\$£]#,##0.00' | £121.85 |
| 121.854 | '\$#,##0.00' | \$121.90 |
#### Add units to dimensions
You can add a `format` to your dimensions this:
```yaml theme={null}
models:
- name: sales
columns:
- name: revenue
meta:
dimension:
format: '[$£]#,##0.00'
```
```yaml theme={null}
models:
- name: sales
columns:
- name: revenue
config:
meta:
dimension:
format: '[$£]#,##0.00'
```
```yaml theme={null}
type: model
name: sales
dimensions:
- name: revenue
format: '[$£]#,##0.00'
```
To see which format types are available for dimensions, [check the reference docs here.](/references/dimensions#format). Check out [this doc](/references/dimensions#dimension-configuration) to see all of the other properties you can customize for dimensions.
#### Add units to metrics
You can add a `format` to your metrics this:
```yaml theme={null}
models:
- name: sales
columns:
- name: revenue
meta:
metrics:
total_revenue:
type: sum
format: '[$£]#,##0.00'
```
```yaml theme={null}
models:
- name: sales
columns:
- name: revenue
config:
meta:
metrics:
total_revenue:
type: sum
format: '[$£]#,##0.00'
```
```yaml theme={null}
type: model
name: sales
dimensions:
- name: revenue
metrics:
total_revenue:
type: sum
sql: ${TABLE}.revenue
format: '[$£]#,##0.00'
```
To see which format types are available for metrics, [check the reference docs here.](/references/metrics#format)Check out [this doc](/references/metrics#metric-configuration) to see all of the other properties you can customize for metrics.
### Conditional formatting using parameters
You can make your field formatting dynamic by using [parameters](/guides/developer/using-parameters) in your format strings. This allows the format to change based on user selections without needing to reconfigure your charts.
#### Simple parameter substitution
You can reference parameter values directly in your format strings using the syntax `${ld.parameters.parameterName}`.
For example, if you have a parameter called `currency_symbol`, you can use it in your format like this:
**Step 1: Define your parameter**
In your `lightdash.config.yml` file:
```yaml theme={null}
parameters:
currency_symbol:
label: "Currency symbol"
description: "Conditional formatting for currency symbol"
default: "$"
options:
- "$"
- "€"
```
**Step 2: Use the parameter in your format string**
In your model YAML file:
```yaml theme={null}
models:
- name: sales
columns:
- name: revenue
meta:
metrics:
total_revenue:
type: sum
format: '${ld.parameters.currency_symbol}0,0.00'
```
```yaml theme={null}
models:
- name: sales
columns:
- name: revenue
config:
meta:
metrics:
total_revenue:
type: sum
format: '${ld.parameters.currency_symbol}0,0.00'
```
```yaml theme={null}
type: model
name: sales
dimensions:
- name: revenue
metrics:
total_revenue:
type: sum
sql: ${TABLE}.revenue
format: '${ld.parameters.currency_symbol}0,0.00'
```
The format `'${ld.parameters.currency_symbol}0,0.00'` will substitute the selected currency symbol value directly into the format.
When users select `$` from the parameter dropdown, numbers will display as `$1,234.56`. When they select `€`, numbers will display as `€1,234.56`.
#### Conditional formatting with ternary expressions
For more complex formatting logic, you can use ternary expressions in your format strings. The syntax is:
```
${ld.parameters.parameterName=="value"?"format_if_true":"format_if_false"}
```
Here's an example that displays different currency symbols based on a `currency` parameter:
**Step 1: Define your parameter**
In your `lightdash.config.yml` file:
```yaml theme={null}
parameters:
currency:
label: "Currency"
description: "Conditional formatting for currency"
default: "usd"
options:
- "usd"
- "eur"
- "gbp"
```
**Step 2: Use the parameter in your format string with conditional logic**
In your model YAML file:
```yaml theme={null}
models:
- name: sales
columns:
- name: revenue
meta:
metrics:
total_revenue:
type: sum
format: '${ld.parameters.currency=="usd"?"$":""}${ld.parameters.currency=="eur"?"€":""}${ld.parameters.currency=="eur"?"£":""}0,0.00'
```
```yaml theme={null}
models:
- name: sales
columns:
- name: revenue
config:
meta:
metrics:
total_revenue:
type: sum
format: '${ld.parameters.currency=="usd"?"$":""}${ld.parameters.currency=="eur"?"€":""}${ld.parameters.currency=="eur"?"£":""}0,0.00'
```
```yaml theme={null}
type: model
name: sales
dimensions:
- name: revenue
metrics:
total_revenue:
type: sum
sql: ${TABLE}.revenue
format: '${ld.parameters.currency=="usd"?"$":""}${ld.parameters.currency=="eur"?"€":""}${ld.parameters.currency=="eur"?"£":""}0,0.00'
```
The format uses multiple ternary expressions to check the parameter value:
* When `currency` is `"usd"`, displays `$1,234.56`
* When `currency` is `"eur"`, displays `€1,234.56`
* When `currency` is `"gbp"`, displays `£1,234.56`
**Another example: Controlling decimal places**
You can use conditional formatting to toggle between different precision levels.
Define your parameter in `lightdash.config.yml`:
```yaml theme={null}
parameters:
decimals:
label: "Decimals"
description: "Conditional formatting for decimals"
default: "true"
options:
- "true"
- "false"
```
Then use it in your model YAML file:
```yaml theme={null}
models:
- name: sales
columns:
- name: revenue
meta:
metrics:
total_revenue:
type: sum
format: '0,0${ld.parameters.decimals=="true"?".00":""}'
```
```yaml theme={null}
models:
- name: sales
columns:
- name: revenue
config:
meta:
metrics:
total_revenue:
type: sum
format: '0,0${ld.parameters.decimals=="true"?".00":""}'
```
```yaml theme={null}
type: model
name: sales
dimensions:
- name: revenue
metrics:
total_revenue:
type: sum
sql: ${TABLE}.revenue
format: '0,0${ld.parameters.decimals=="true"?".00":""}'
```
When `decimals` is `"true"`, numbers display as `$1,234.56`. When `decimals` is `"false"`, numbers display as `$1,235`.
## Formatting your fields in the Lightdash UI
You can also format your fields in the Lightdash UI. This is useful if you want to format your fields quickly without having to change your YAML files.
Currently you can format 2 types of fields in the Lightdash UI:
* Custom metrics ([reference](/guides/custom-fields#custom-metrics))
* Table calculations ([reference](/guides/table-calculations))
### Formatting metrics
Metrics formatting is currently only available for numeric metric types.
You can adjust the formatting of your pre-defined metrics from the results table.
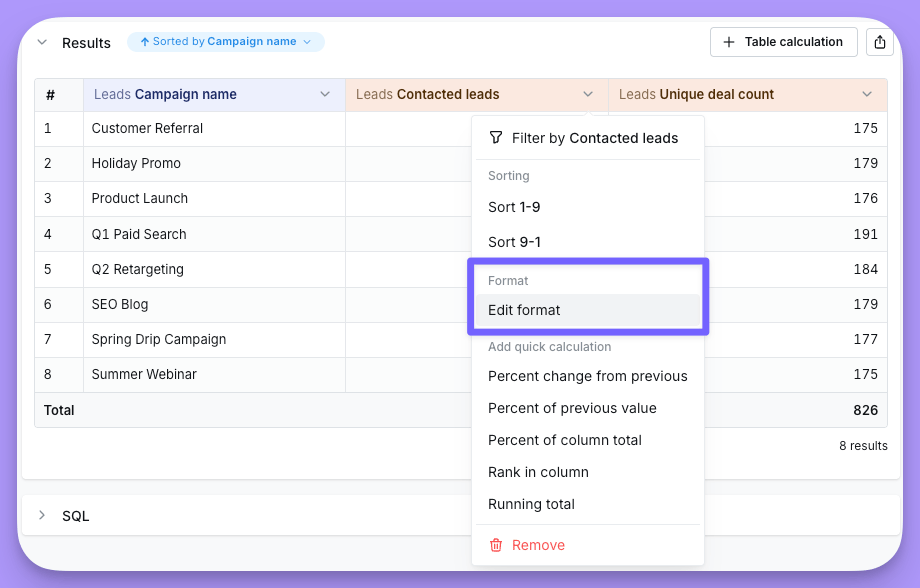 You can customize the formatting of your custom metrics when you create them, and later on from the results table.
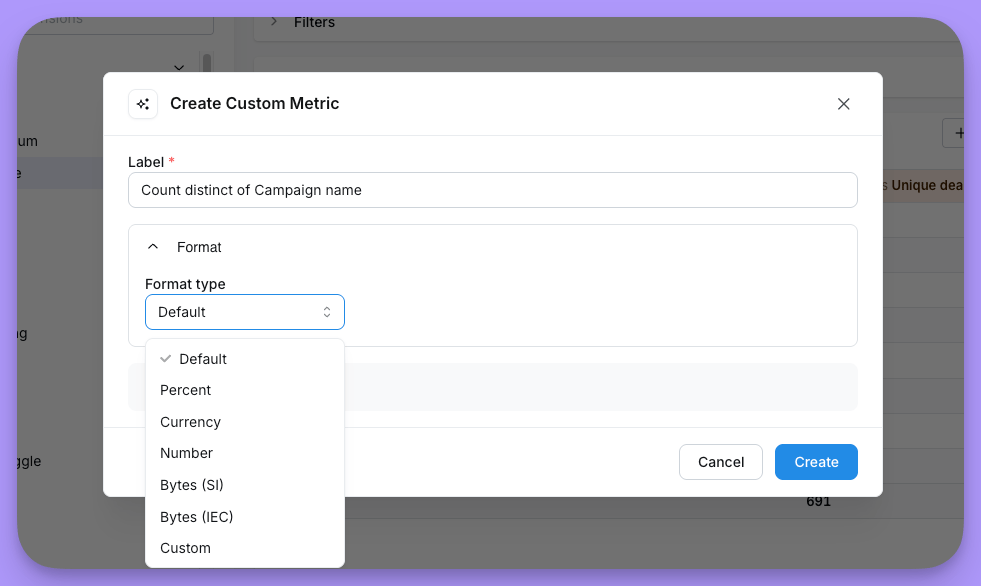 These are the formatting options available:
* `percent`: Formats your metric as a percentage, with the following options:
* `round` value to your metric to round it to a certain number of decimal places
* `separator`, e.g. from `.` to `,`
* `currency`: Formats your metric as a currency
* `round` value to your metric to round it to a certain number of decimal places
* `separator`, e.g. from `.` to `,`
* `currency` symbol, e.g. from `$` to `£`
* `compact` value to compact your metric to a certain unit, e.g. from `1,000,000` to `1M`
* `number`: Formats your metric as a number
* `round` value to your metric to round it to a certain number of decimal places
* `separator`, e.g. from `.` to `,`
* `compact` value to compact your metric to a certain unit, e.g. from `1,000,000` to `1M`
* `prefix` value to add a prefix to your metric, e.g. `+` or `-`
* `suffix` value to add a suffix to your metric, e.g. `%`
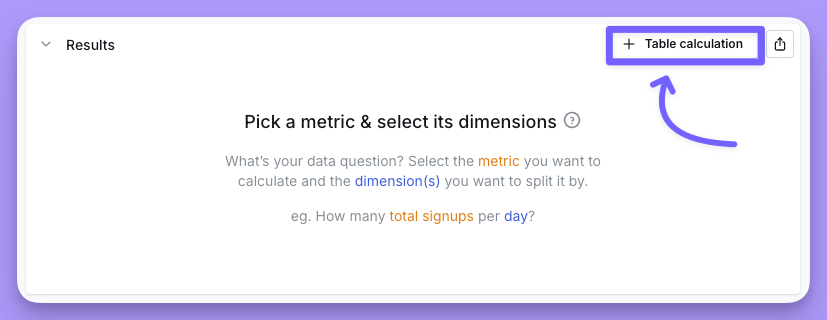
### Formatting table calculations
On the results table, you can add a table calculation by clicking on the button on the right hand side of the section.
These are the formatting options available:
* `percent`: Formats your metric as a percentage, with the following options:
* `round` value to your metric to round it to a certain number of decimal places
* `separator`, e.g. from `.` to `,`
* `currency`: Formats your metric as a currency
* `round` value to your metric to round it to a certain number of decimal places
* `separator`, e.g. from `.` to `,`
* `currency` symbol, e.g. from `$` to `£`
* `compact` value to compact your metric to a certain unit, e.g. from `1,000,000` to `1M`
* `number`: Formats your metric as a number
* `round` value to your metric to round it to a certain number of decimal places
* `separator`, e.g. from `.` to `,`
* `compact` value to compact your metric to a certain unit, e.g. from `1,000,000` to `1M`
* `prefix` value to add a prefix to your metric, e.g. `+` or `-`
* `suffix` value to add a suffix to your metric, e.g. `%`
### Formatting table calculations
On the results table, you can add a table calculation by clicking on the button on the right hand side of the section.
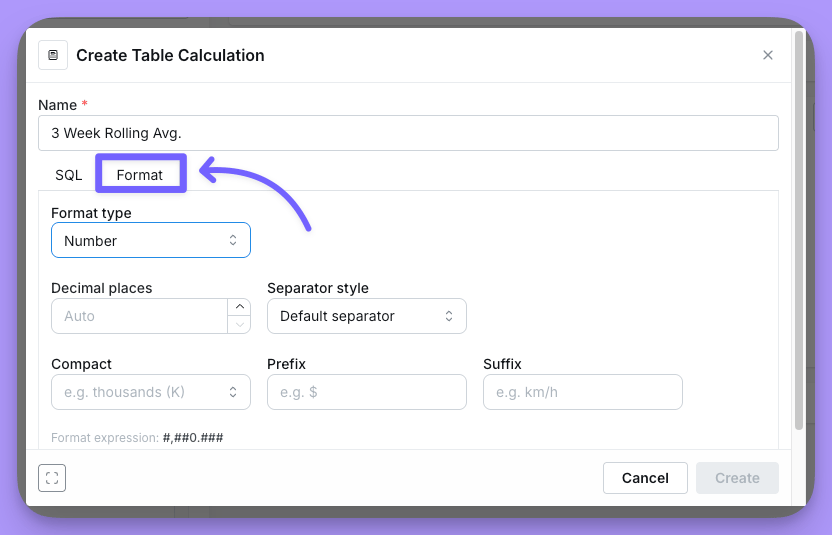
 Once you've created your table calculation, you can format it by clicking on the `Format` tab:
 You can then choose from the following formatting types:
* `percent`: Formats your metric as a percentage, with the following options:
* `round` value to your metric to round it to a certain number of decimal places
* `separator`, e.g. from `.` to `,`
* `currency`: Formats your metric as a currency
* `round` value to your metric to round it to a certain number of decimal places
* `separator`, e.g. from `.` to `,`
* `currency` symbol, e.g. from `$` to `£`
* `compact` value to compact your metric to a certain unit, e.g. from `1,000,000` to `1M`
* `number`: Formats your metric as a number
* `round` value to your metric to round it to a certain number of decimal places
* `separator`, e.g. from `.` to `,`
* `compact` value to compact your metric to a certain unit, e.g. from `1,000,000` to `1M`
* `prefix` value to add a prefix to your metric, e.g. `+` or `-`
* `suffix` value to add a suffix to your metric, e.g. `%`
You can then choose from the following formatting types:
* `percent`: Formats your metric as a percentage, with the following options:
* `round` value to your metric to round it to a certain number of decimal places
* `separator`, e.g. from `.` to `,`
* `currency`: Formats your metric as a currency
* `round` value to your metric to round it to a certain number of decimal places
* `separator`, e.g. from `.` to `,`
* `currency` symbol, e.g. from `$` to `£`
* `compact` value to compact your metric to a certain unit, e.g. from `1,000,000` to `1M`
* `number`: Formats your metric as a number
* `round` value to your metric to round it to a certain number of decimal places
* `separator`, e.g. from `.` to `,`
* `compact` value to compact your metric to a certain unit, e.g. from `1,000,000` to `1M`
* `prefix` value to add a prefix to your metric, e.g. `+` or `-`
* `suffix` value to add a suffix to your metric, e.g. `%`